|
P dV's Custom Data Acquisition Systems Capabilities Select from the list below:
|
| • Engine Test Cell Data Acquisition |
| • Engine Cylinder Pressure Data Acquisition |
| • Cylinder Pressure Hardware Support |
| • Custom Data Acquisition Systems |
|
• Instrumentation & Data Acquisition Hardware
|
|
|
|
P dV Designs, Develops, and Implements Engine Test Cell Data Acquisition Systems
|
|
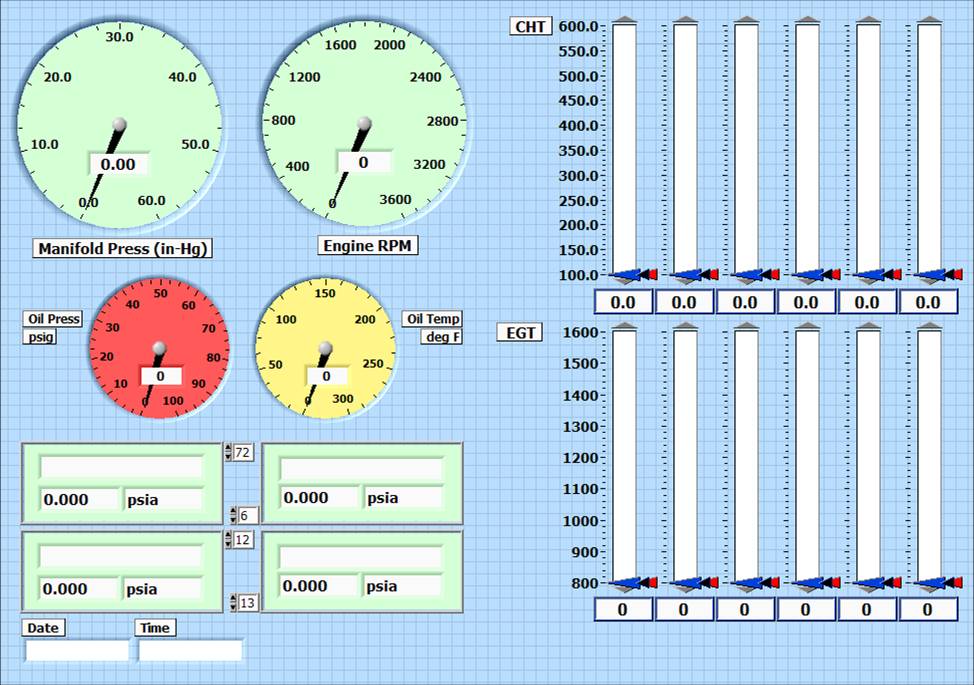
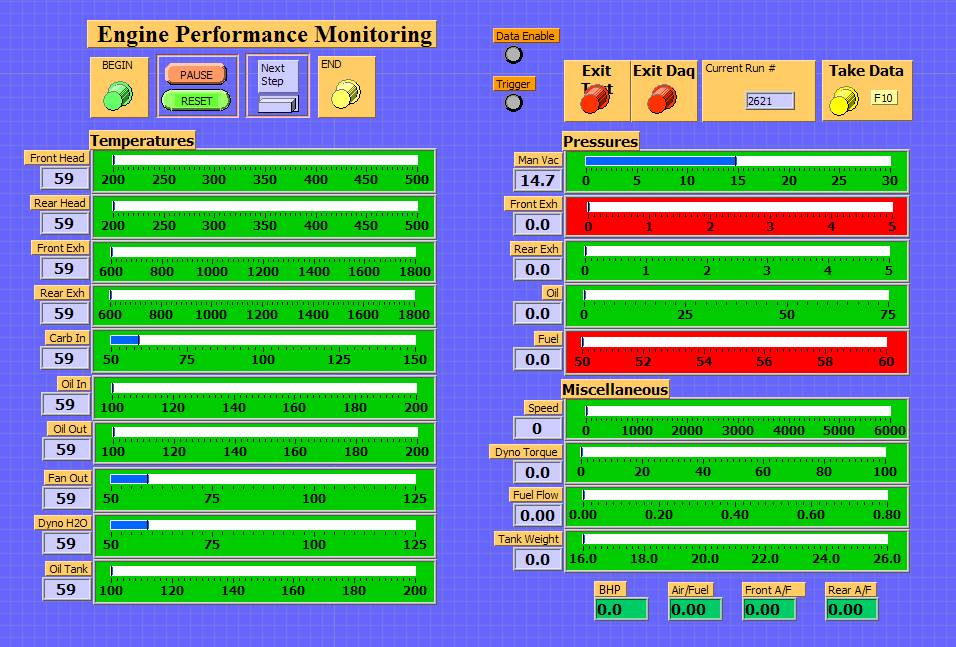
• Custom Engine Test Cell Data Aquisition Systems
P dV designs, develops, and implements custom engine test cell data acquisition systems to customer specifications, blending customer needs and desires with P dV's engine test experience to provide the proper solution for the application. If the customer does not have a specification, P dV can develop one to define the requirements given the needs of the application. This specification can include both the hardware bill-of-materials and the software functionality required to meet customer needs. Once a specification is developed, P dV can quote on the cost and schedule to design, develop, integrate, and test the application for the client.
|
|
• Flexibility is the Key
P dV's first complete data acquisition system, including hardware and software integrated together, was designed in 1995, and was born out of necessity. The existing test cell data acquisition system was simple and rigid, and did not provide for the test-to-test flexibility the client required. After attending National Instruments training courses to learn the essentials of NI hardware and LabVIEW software, a new data acquisition system was designed, providing the ability to adapt to the client's rapidly changing requirements. Using National Instruments hardware with growth potential, and LabVIEW software for quick design updates, provided the capabiliy to meet changing customer test needs. Ultimately, test cell control was added to provide repeatability in the data acquisition process, and reduce operator workload.
|

|
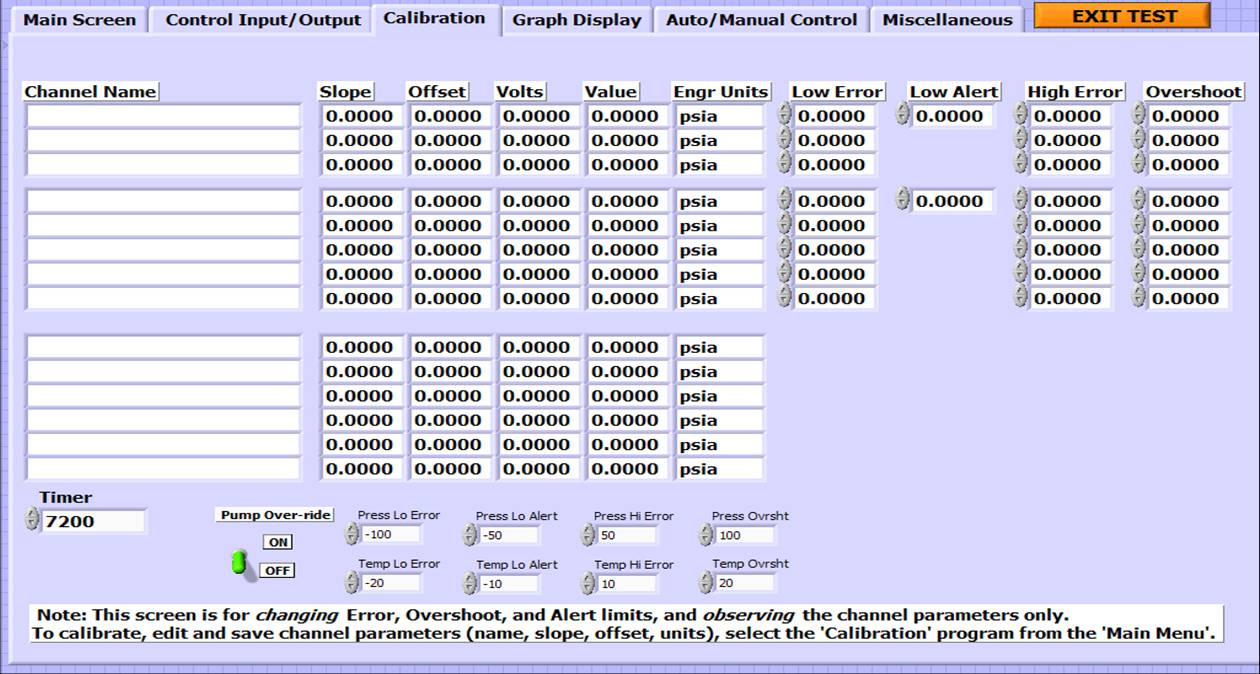
• Integrated Data Acquisition Systems with Calibration, Information Management and Test Control
Over the years of data acquisition system development, a philosophy emerged that has formed the basis of P dV's data acquisition and control systems. Acquiring and recording data is not enough. Specific engine and test information must be captured and managed. Instrumentation must be calibrated. Post-processing of important parameters from acquired data is now acomplished in real time. Test control parameters must to be accurate and repeatable, and reduce the chance of operator error. The test operator must be comfortable with the system setup and usage. Above all, the system must be capable enough to meet all client and test requirements, and flexible enough to meet changing test needs. (for additional information on specific test cell control applications, see Custom Process Control Applications)
|
|
|
|
|
|
P dV Designs, Develops, and Implements Engine Cylinder Pressure Data Acquisition & Analysis
|
|
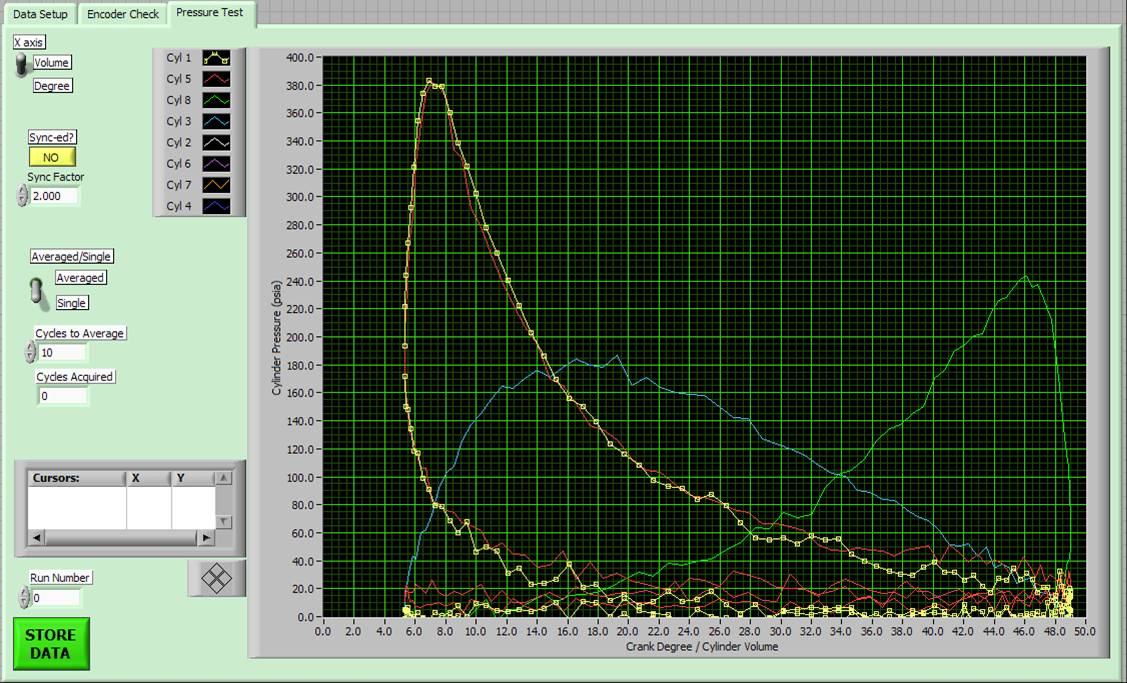
• Custom Cylinder Pressure Acquisition Systems
Prompted by the high cost and low availability of commercial cylinder pressure data systems, and to allow for specific customer needs and
desires, a custom cylinder pressure data system was designed and implemented in an engine test cell. • Inputs for engine configuration such as bore, stroke, compression ratio, clearance volume
|

|
• Inputs for pegging pressure (input from manifold pressure trandsucer), and pegging location
• Ability to view encoder signals in a time-based format • Ability to view encoder signals in an event-based format (triggered by Z-pulse) • Ability to determine encoder Z-pulse offset from TDC using Log-P, Log-V motoring pressure plot analysis • Syncronization of Z-pulse to TDC on compression for cylinder #1 • Ability to view pressure traces in real time versus either degrees or cylinder volume • Ability to view single pressure trace or average of multiple traces • Option to view and store cylinder pressures on a time basis, triggered by Z-pulse • Data stored as pegged cylinder pressure versus both crankshaft degrees and cylinder volume • Data allows for plotting cylinder pressure versus crank degrees or cylinder volume (including log-P vs. log-V) • Additional data storage file with raw transducer voltage for post-processing as desired
|

|
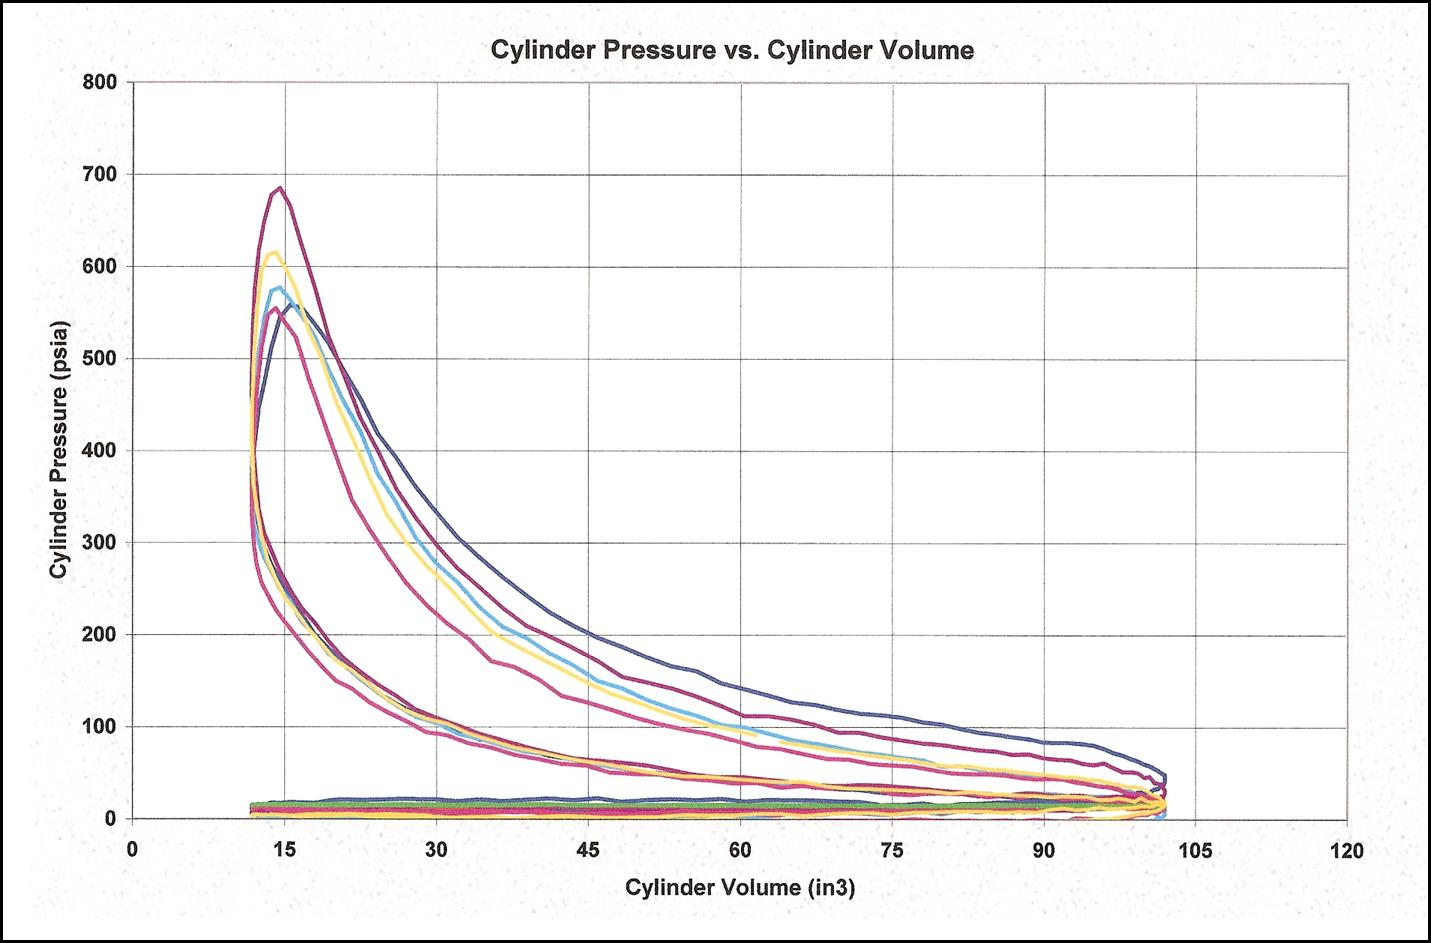
• Building on a Solid Foundation
Learning from the at-the-time industry standard, DSP Technology, Inc., training courses were attended to learn how to use the Redline ACAP system, to set up test cell hardware and instrumentation, and to insure proper pressure data acquisition and analysis. This system was used for a number of years, and while expensive to purchase, it was very good at obtaining cylinder pressure data. Being a commercial system, it lacked the flexibility of being able to modify the software for custom applications. In addition, data reduction and presentation was limited, though adequate if one did not use other applications, such as Microsoft Excel. Many times the data manipulation, plotting, and presentation were performed by Excel and other similar software packages, using the raw pressure data obtained from the Redline ACAP system. This is the approach now taken by P dV in developing cylinder pressure data applicactions: leave the plotting and presentation to existing commmercial packages, and place the focus on obtaining the best data possible at the front end. If required by the end user, data template files can be created in Excel to import, plot, and present the data in the required format.
|
|
• Cylinder Pressure Analysis
Cylinder pressure acquisition in a running engine allows one to see inside the "heart" of the engine combustion process.
|
|
|
|
|
|
P dV Provides Engine Cylinder Pressure Acquisition Hardware Support
|

|
• Engine Pressure Transducer and Crankshaft Encoder Installation
P dV has experience in setting up numerous types of engines with cylinder pressure transducers and crankshaft encoders. Some engines are straight forward, allowing transducers to be flush-mounted in the cylinders, and encoders to be easily attached to crankshafts. Others present unique challenges to mounting one or both components. Some run extremely hot and require water-cooled pressure transducers. Others require drilling through and sealing water jackets or other passages. Perhaps the crankshaft is not accessible, and the encoder must be mounted on the camshaft, requiring a high-count encoder for adequate pressure-per-degree resolution. Often, special adapters and mounts are required to properly attach the encoder to the engine, regardless whether crankshaft or camshaft. There are times when the pressure transducer must be mounted in a specially designed sparkplug, using a tube passage from the spark plug thread area to the transducer. P dV has experience with these challenges, and can offer the best solution for the application. But what to do when neither the crankshaft or camshaft is accessible for encoder mounting?...
|
|
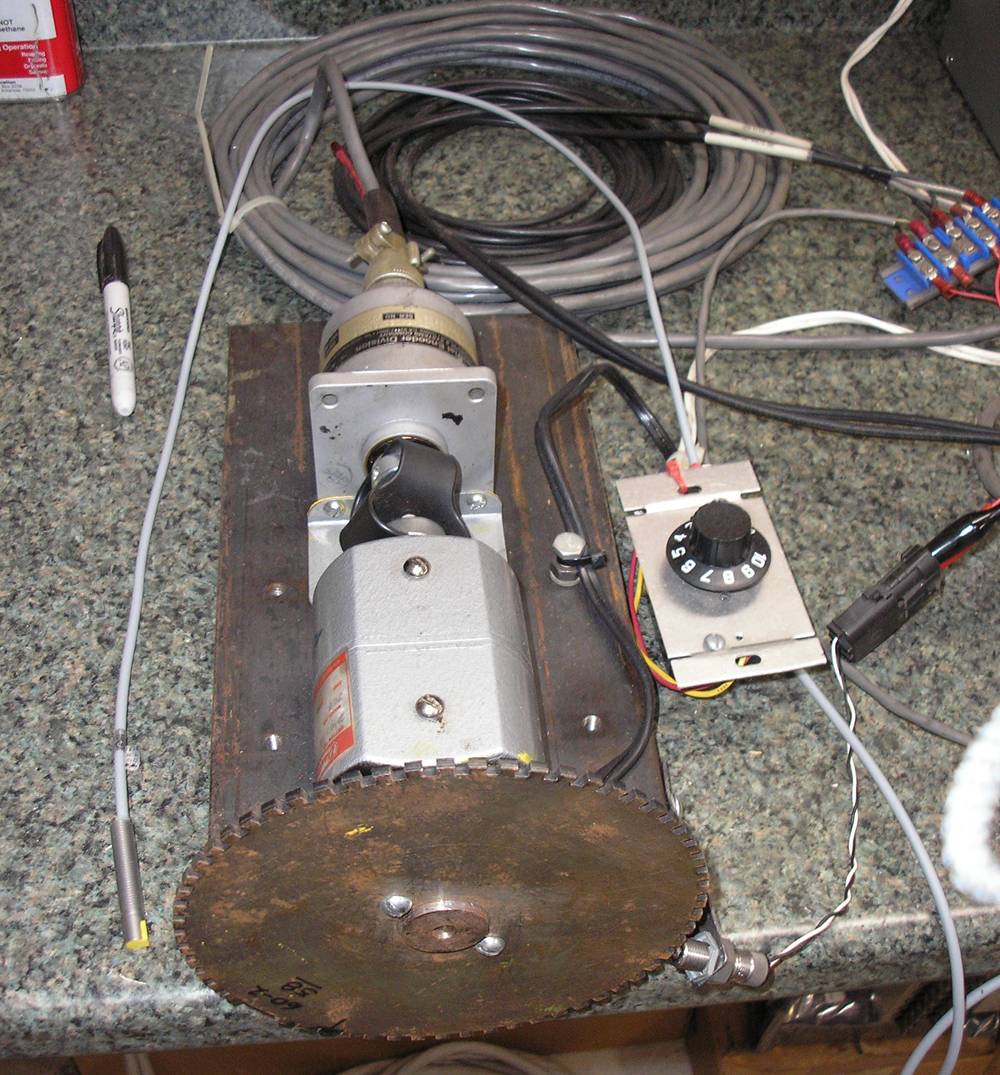
• Custom Engine Encoder Instrumentation Development
When the crankshaft or camshaft could not be accessed to attach a standard optical shaft encoder, it was determined that the engine's toothed starter ring gear on the flywheel would have to be used to provide the event-based signal for the data acquisition. Typically, using the engine mounted in a test cell is not the ideal test bed to be developing an encoder application, especially when the engine is air-cooled and fuel is expensive. Then there are engine operators hours spent, and other tests that are being pushed aside. P dV solved the problem by using a simple test bench toothed wheel to simulate the engine's toothed flywheel, allowing development of the hardware and software required to trigger off of the flywheel teeth and provide event-based capturing of cylinder pressure. The variable-speed electric motor has a standard optical shaft encoder mounted on one end, and a toothed wheel mounted on the other. This arrangement not only allows for testing of various types of sensors to read the toothed wheel, but also allows comparison to a known standard. The two basic types of sensors tested included variable reluctance sensors (VRS) and Hall-effect sensors. The best combination of sensors was determined to be a Hall-effect sensor reading a bolt head at or near TDC on the flywheel, and a VRS measuring the teeth passing on the flywheel. The particular VRS sensor selected incorporated a filtering amplifier that took the signal of the VRS, which varies as a function of tooth-passing speed, and converts it to a 5 volt square wave. This provided two square wave inputs to the data acquisition system that could be used to determine engine position and trigger the sampling of the pressure transducers.
|
|
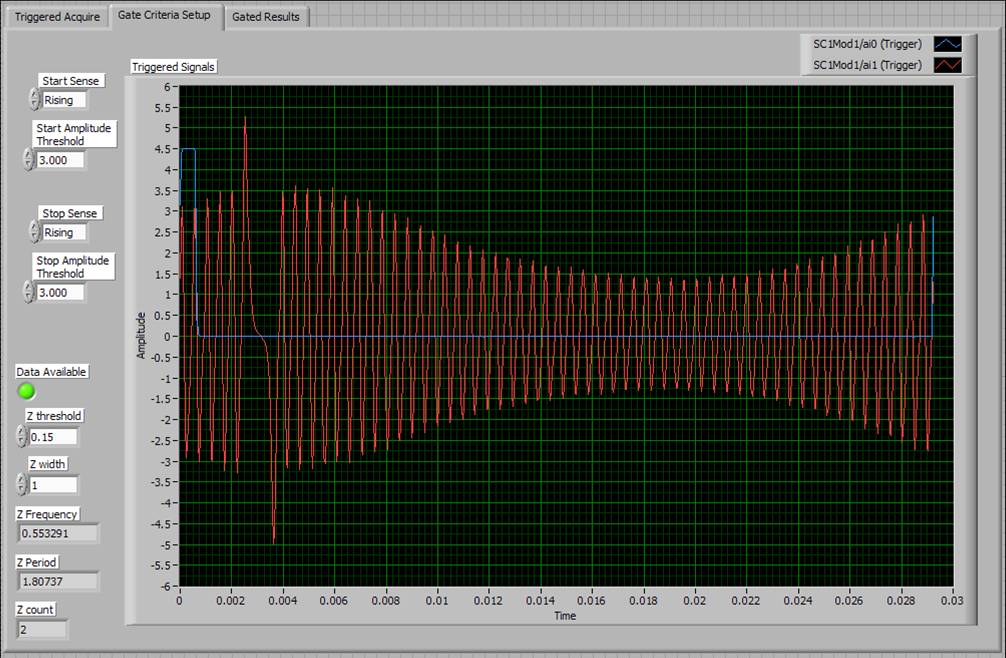
• Engine Encoder Test and Integration with Software
Having the encoder bench test system working allowed for faster development of the optimum software to trigger off of the VRS reading flywheel teeth (A-pulse), check for the "one-per-revolution" hall effect sensor (Z-pulse), and read the cylinder pressure sensors and manifold pressure sensor (for pegging the cylinder pressure transducers). Using the variable-speed electric motor allowed the hardware and software to be tested over the anticipated engine operating speed range. It also allowed development of the code to optimize the through put of data arrays, allowing for calculations of pressures from transducer voltages, incuding pegging, and calculating the crankshaft position, relative to each cylinder, and each cylinder's respective volume. Algorithms converted the one-per-revolution Z-pulse into a complete engine cycle (two full revolutions), while checking that the appropriate number of A-pulses had been read for a full cycle. Error checking routines discarded data from cycles that did not contain the number of data points that corresponded to the anticipated number of flywheel teeth, preventing the averaging of data points that were not fully syncronized with the engine.
|
|
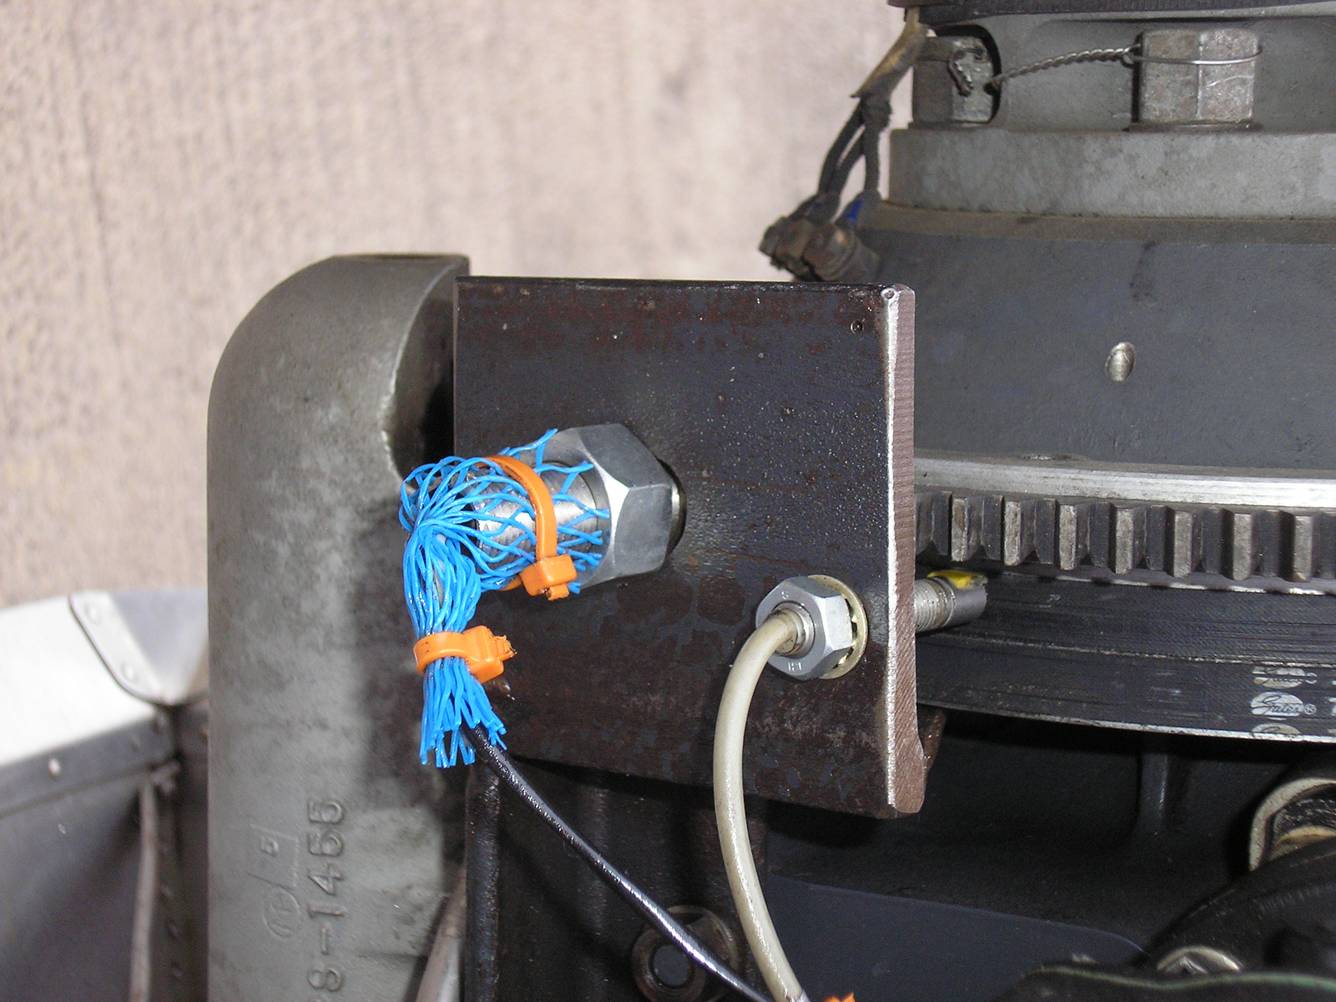
• Custom Engine Encoder Installation and Integration
Having been thouroughly tested on the bench, the encoder sensors and the software used to read them were moved to the engine test cell to integrate with the engine. An appropriate sensor mount was made to attach both sensors to the engine, and space them as required from the flywheel ring gear teeth. The only adjustment build into the mount was a slight slotting of the VRS sensor hole to allow it to be positioned so that the rising edge of the Z-pulse signal would occur between the two closest gear teeth rising edge signals, preventing unwanted over or under counting do to possible phase shifts with changes in engine speed. The Z-pulse trigger did not have to be located exactly at TDC of the #1 cylinder, as the software was designed to determine the offset of this signal from true TDC thermodynamically, using a Log-pressure vs. Log-cylinder volume motoring pressure trace. The offset was calculated to collapse the rising and falling pressure curves into a single line. This method provides a very accurate location of TDC as long as the engine is in sound condition, with rings and valves that seal properly.
|
|
• Custom Engine Encoder Software Algorithms
The offset of the Z-pulse relative to the thermodynamic TDC is then added or subtracted to the degrees measured by the A-pulse to track engine position of the #1 cylinder. Offsets between cylinders of a multi-cylinder engine are calculated from engine configuration inputs to determine the positions of each cylinder. If desired or required, the actual TDC of each cylinder can be measured using the same thermodynamic TCD method from each cylinders motoring pressure trace, with the resulting offset being used in the cylinder's position calculation. This method will account for variations in cylinder-to-cylinder TDC variations due to manufacturing tolerances.
|
|
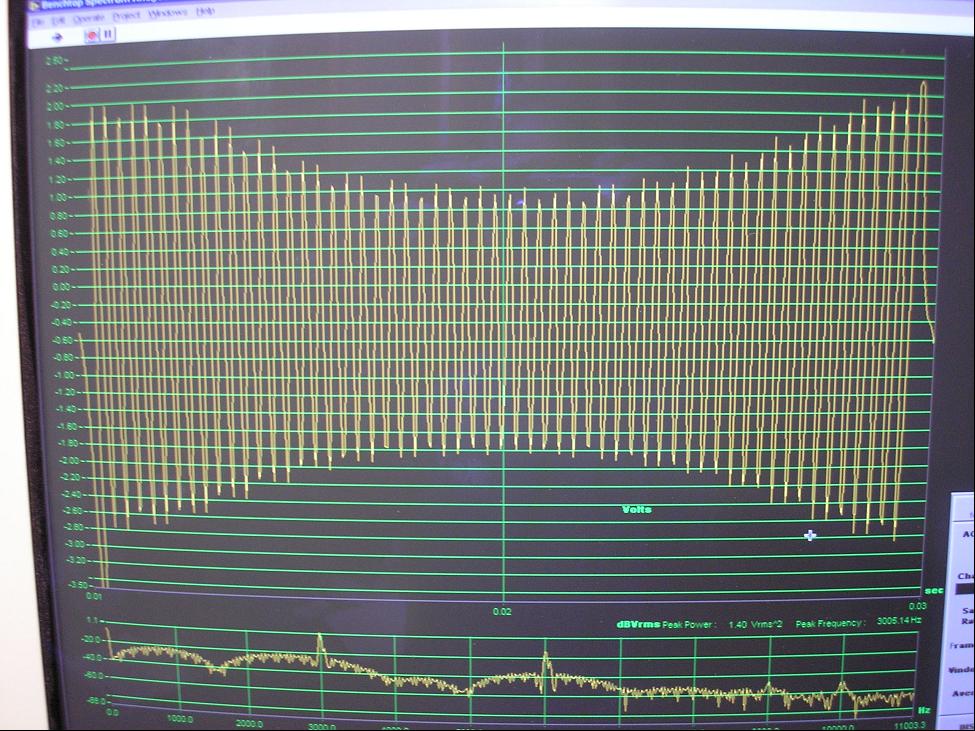
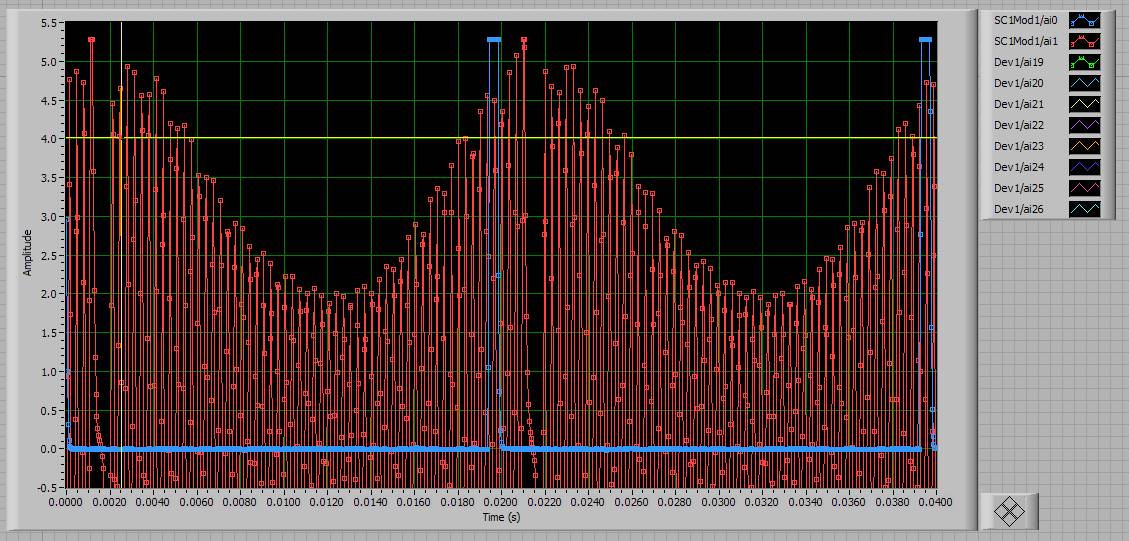
In P dV's experience, it is the encoder setup that causes the most downtime in acquiring cylinder pressure data. To aid in insuring proper encoder operation,
two different encoder testing software routines were designed to allow checking of the encoder signal. One uses a time-base, triggered by the Z-pulse, and
can be used to debug A-pulse problems. The other is event-based, triggered by the A-pulse, which counts the number of A pulses between Z pulses, comparing
that number to the anticipated value. The number of full cycles is compared to cycle count errors to obtain a percentage of full cycle counts that the
encoder is providing.
|
|
|
|
|
|
P dV Provides Custom Data Acquisition Systems
|
|
• Data Acquisition Software for Custom Applications
P dV's experience and capabilities are not limited to engine test cells. P dV has built data acquisition systems for a turbocharger test cell, for vehicles,
and for industrial process and component test stands. P dV can build software data systems for:
|
|
• Data Acquisition Hardware for Custom Applications
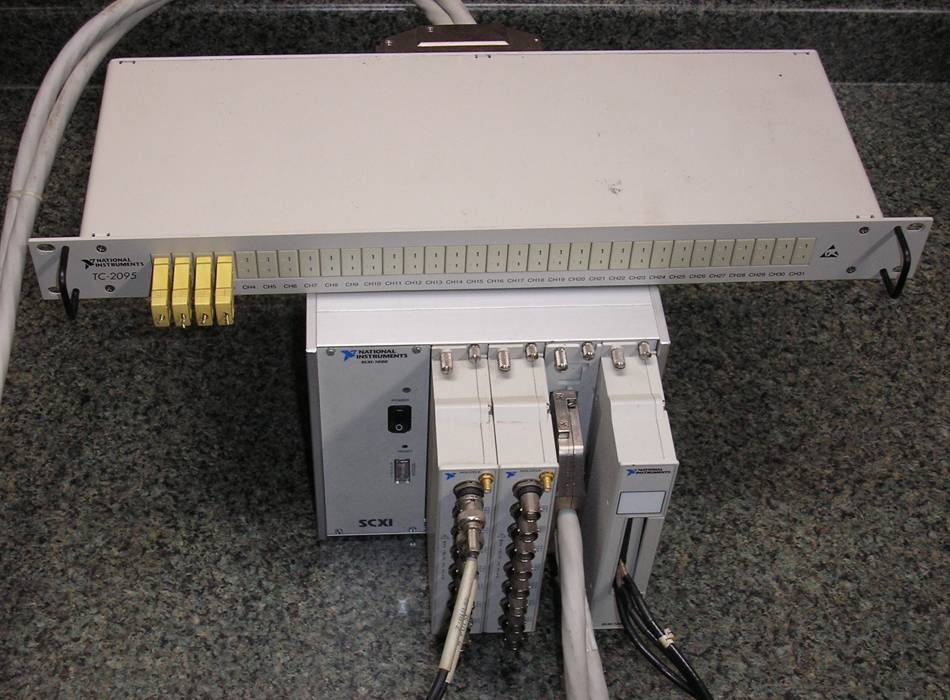
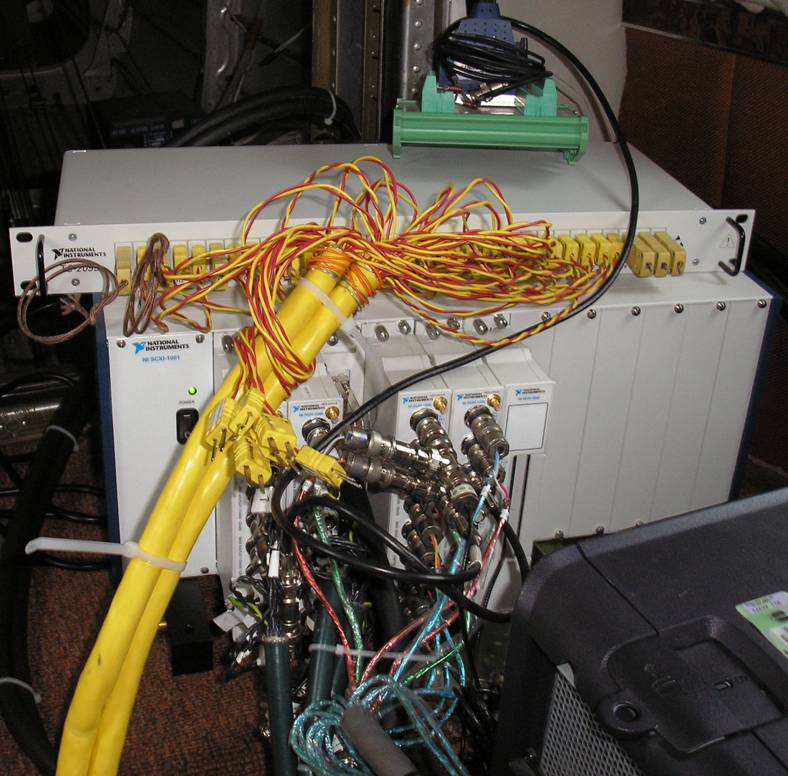
While P dV has used several different types of data acquisition hardware from several different manufacturers, it has settled on National Instruments as its prefered choice for data acquisition hardware. National Instruments has an extremely broad array of hardware platforms, and it is highly probable that one can work for a specific application. One example of a flexible signal conditioning and data acquisition system is the SCXI-based chassis and modules, connected to a PCI slot data acquisition card in a desktop PC.
|
|
• Custom Integration, Installation, and Data Acquisition Support
Through years of experience, P dV can select the appropriate data acquisition hardware, design and develop the software application, integrate and test the hardware and software system, and install it to work with your application. If you are looking for a turnkey system, P dV can also specify, install and calibrate the necessary instruments and trandsucers to obtain the data and control you requiring. In addition, if you have an engine, vehicle, or component which needs to be tested, P dV can develop the test program and data requirements, and support the testing process through data reduction and analysis.
|
|
|
|
|
|
P dV Provides Instrumentation & Data Acquisition Hardware Support
|

|
• Engine Cylinder Pressure Instrumentation: Specification and Installation
P dV's experience in cylinder pressure instrumentation extends to pressure transducer selection and mounting in the engine. P dV also has experience with the calibration requirements of the different types of pressure transducers, especially the technique of calibrating piezo-type transducers using a dead weight pressure tester. P dV can set up the data acquisition software to work with the data acquisition hardware to read and record the output of the transducer while using the dead-weight tester technique. P dV has calibrated and maintained records for sensors as required to meet ISO standards for documentation.
|
|
• Instrumentation Specification and Selection
Having set up numerous test cells, P dV can specify the required instrumentation to meet your data acquistion needs. If you know what testing you need, P dV
will determine a list of parameters that must be either measured or calculated, and specify the instrumentation required to obtain that data. This includes
such calculations as corrected engine parameters, i.e. corrected brake horsepower (per SAE J1349 Standard), and the conditions that must be measured to determine
such a correction factor, i.e. ambient temperature, barometric pressure, relative humidity or dewpoint (all used to calculate dry air conditions).
|
|
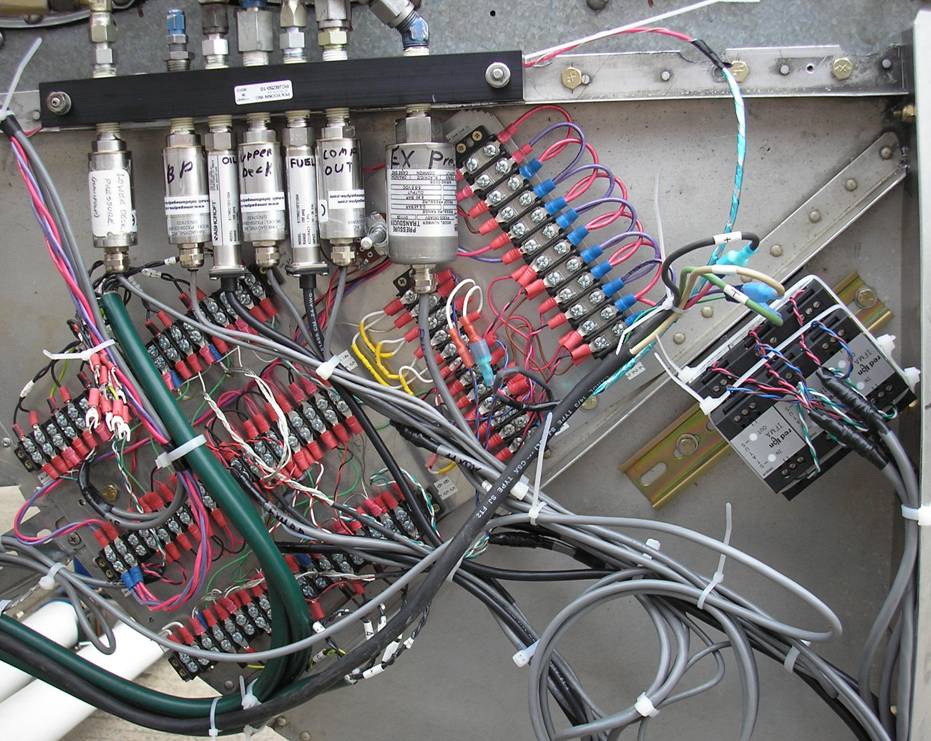
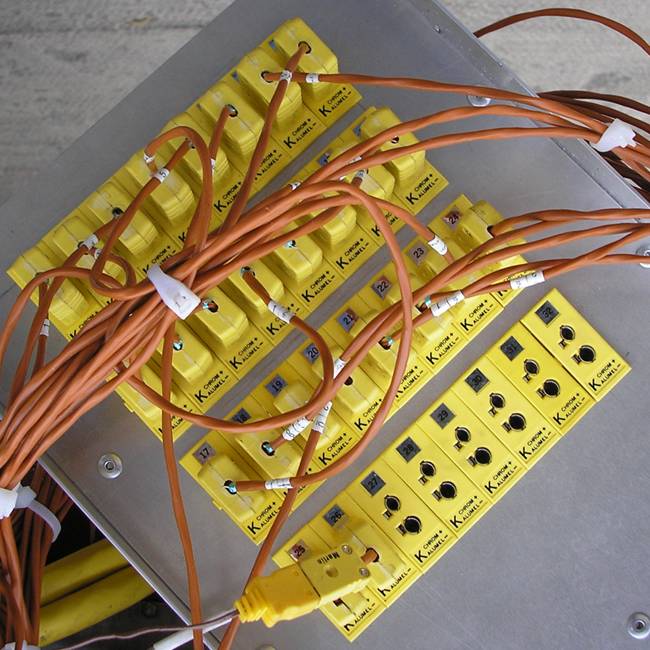
• Instrumentation Installation and Calibration Support
P dV is available to specify and supervise the installation and commissioning of instrumentation setups, including drawings and specifications as required. This includes best practices with regards to wiring of transducers and sensors, power supply requirements for instrumentation, and shielding and grounding requirements. P dV has experience with the calibration requirements of many different types of instruments including temperature, pressure, flow rate, force, rotation speed, and others. P dV can set up the data acquisition software to work with the data acquisition hardware to read and record the output of the sensor or transducer being calibrated. P dV has calibrated and maintained records for sensors as required to meet ISO standards for documentation.
|
|
|
|
|