|
P dV's Internal Combustion Engine Research, Testing, &
Development Capabilities
Select from the list below:
|
|
P dV Can
Conduct Engine Development Testing
|
|

|
• Performance Development
P dV has conducted
performance development testing on internal combustion engines for power
and fuel consumption optimization, and also emissions reduction.
Testing
performed to date includes:
• Induction system development: effects of air filter & housing,
intake tract, throttle body
• Camshaft development: lift, duration, lobe centers (intake to
exhaust), timing relative to the crankshaft
• Combustion chamber: compression ratio, knock margin, squish,
charge motion, spark plug location, valve angles
• Exhaust system development: primary pipe diameter and length,
backpressure from muffler, resonator effects
• Fuel system development: air-fuel ratio effects, peak power, lean
best torque, fuel mapping across speed/load range
• Ignition system development: spark timing relative to location of
peak cylinder pressure, IMEP, knock limits
• Electronic Control System mapping: spark timing, fuel rate, and
fuel injection timing
• Emissions testing & measurement (5 gases), including emissions
reduction development
|
|
|
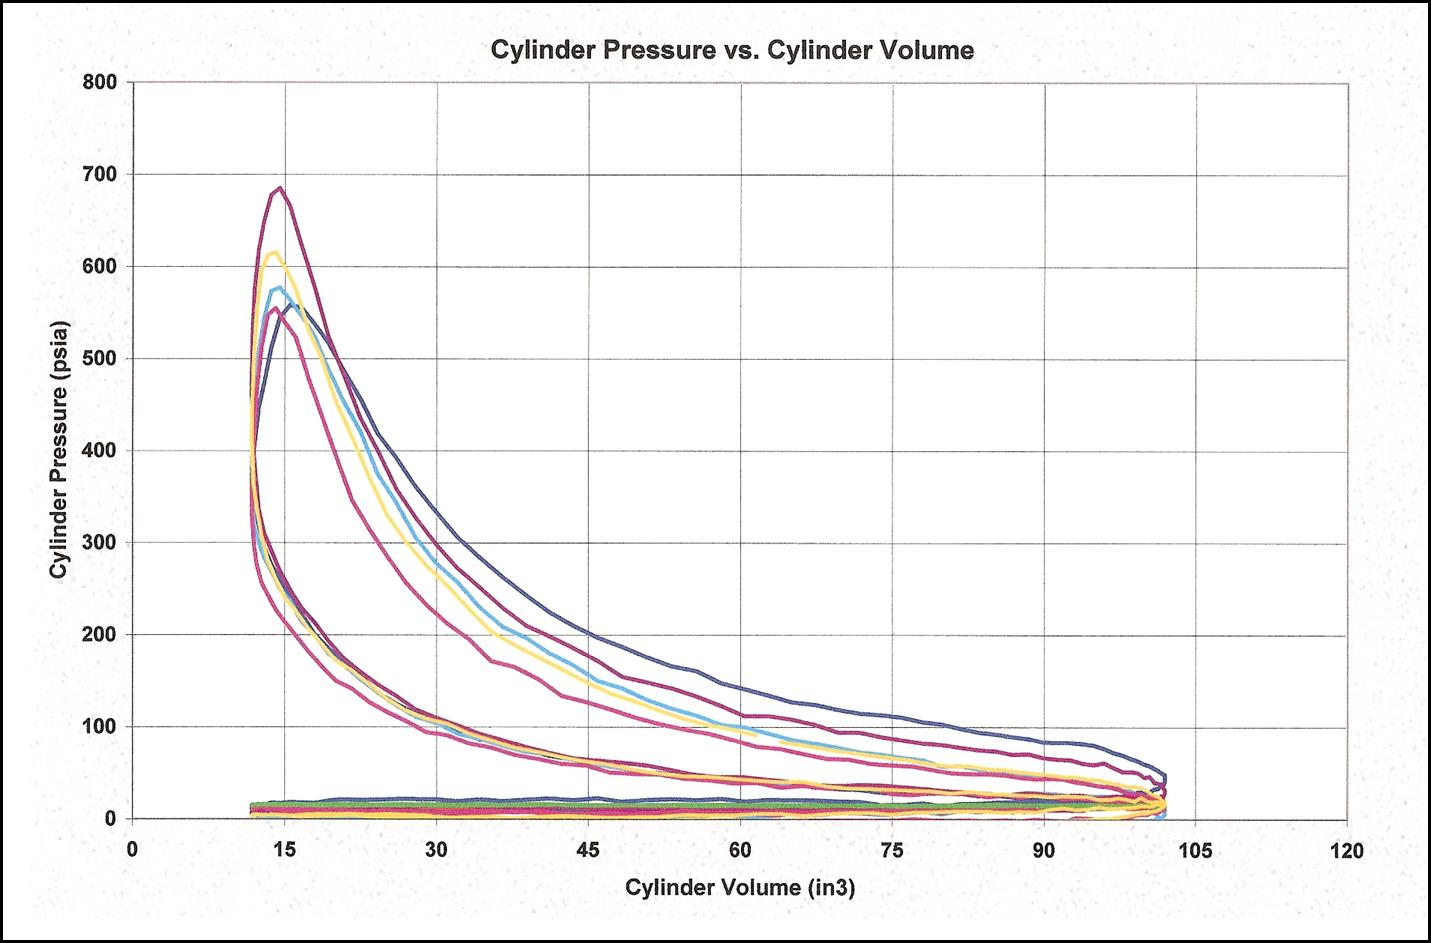
• Cylinder Pressure Acquisition
& Analysis:
•
Attended DSP Technology, Inc.'s training courses on cylinder pressure data
acquisition and analysis, and setup and used DSP Redline ACAP systems for
cylinder pressure acquisition. Experience includes the ability to specify
and install pressure transducers and optical shaft encoders in various
configurations for multiple engine types.
• Used
cylinder pressure data for combustion analysis: mass fraction burned, heat
release rates, peak pressures, location of peak pressures, knock/detonation
detection, and Indicated Mean Effective Pressure (IMEP) calculation.
• P
dV also wrote LabVIEW software and specified hardware to provide a
custom data acquisition system to acquire cylinder pressure data. For
additional information, go to Custom Data
Acquisition Systems, including Cylinder Pressure.
|
|

|
• High Speed Engine Racing Fuels
Testing
A high speed
engine was set up in a test cell and instrumented to obtain speed, torque,
power, fuel flow rate, air-fuel ratio, and engine pressures and temperatures.
The engine was connected to a low inertia, high-speed dynamometer to
control wide-open throttle loads at speeds up to 14,000 rpm. Cylinder
pressure measurement instrumentation was installed on the engine. A fuel
control system was used that allowed fine tuning of ignition spark timing,
fuel flow rate, and fuel injection timing (relative to intake valve
opening). This setup was used to evaluate a matrix of fuels intended for
racing applications by measuring power and cylinder pressure while varying
air-fuel ratio and spark and injection timing. From the cylinder pressure
data, an analysis was made of Indicated Mean Effective Pressure (IMEP),
peak pressure, location of peak pressure, knock (if present), and burn
rates. With this information, the test fuels could be evaluated for their
ability to produce power versus fuel efficiency in terms of fuel
consumption.
|
|

|
• Flow Bench Testing: air flow,
swirl, tumble
Flow bench
testing of engine intake systems has typically been aimed at providing the
maximum amount of air flow at a given pressure drop across the intake. In
reality, big air flow numbers do not always mean big power numbers when the
intake system is installed on an engine. The intake system must be "tuned"
for the engine configuration, aimed at providing the optimum mean flow
velocity in the port for best volumetric efficiency. This can be tuned to
alter the torque curve of the engine if needed.
There are many other uses for the air flow bench, when coupled with the proper
instrumentation. The effect of air-charge motion within the cylinder on
combustion is an important parameter to quantify. By testing the intake
system on an air flow bench for not only air flow, but swirl and tumble air
motions, the effects of port configurations on in-cylinder air motion can
be correlated.
|
|
P dV Can
Conduct Engine Durability Testing
|
|

|
• Durability Testing
P dV has set
up test programs for durability testing of engines, including the test cell
systems required for sustained engine testing, the data acquisition and
control system to monitor and control test conditions, and the test
programs themselves. P dV has specified and installed engine health
monitoring systems to keep track of engine changes during testing. This
includes the measurement of oil consumption, fuel consumption, engine blowby, and periodic checks of compression and
leak-down rates. Oil sampling and analyis for
wear metals, in combination with health monitoring systems, can determine
engine life. One such test monitored engine bearing health with proximity
probes measuring crankshaft run-out in two axes 90 degrees apart. Safety
limits were set and monitored by the control system to shut down the engine
if limits were exceeded. Durability testing often includes the teardown and
inspection of engine components at periodic intervals and/or at end of
test. P dV has experience in analyzing engine components for wear and for
failure analysis.
|
|
Engine Electronic Control System Design, Development,
and Installation
|
|

|
• P dV Has Experience
With Engine Control Systems, including Alternate Fuels
P dV
developed an alternative fuels control system to work with an engine
converted to run on natural gas. Several test programs were conducted on
the sensors and actuators necessary to implement an electronic control
system on an alternative fuel engine. These included the reaction of
various types of oxygen sensors to alternate fuels,
and for sensors to measure and meter the flow of gaseous fuels such as
natural gas or propane. After identifying the sensors and actuators needed
for natural gas fuel metering, an engine control system was designed, in
partnership with an electronics company, to control the fuel and spark for
an engine converted to natural gas. The engine and control system was
installed in a commercial vehicle for testing under normal service
conditions. The engine control system was mapped and calibrated for the
vehicle application, and the vehicle was driven across country on natural
gas to the location at which it was placed in service.
|
|

|
• Engine Control Systems:
calibration & mapping
Often the
engine testing conducted by P dV includes using or working with engine
control systems. This includes the calibration of a control system for both
fuel delivery and spark timing by mapping the engine at desired speed and
load conditions. With an engine installed in a test cell, under the speed
and load control of a dynamometer, and with the proper instrumentation and
data acquisition, the control system can be mapped to provide the optimum
fueling rate and ignition timing to meet the goals of power, fuel economy,
or emissions reduction.
|
|
|
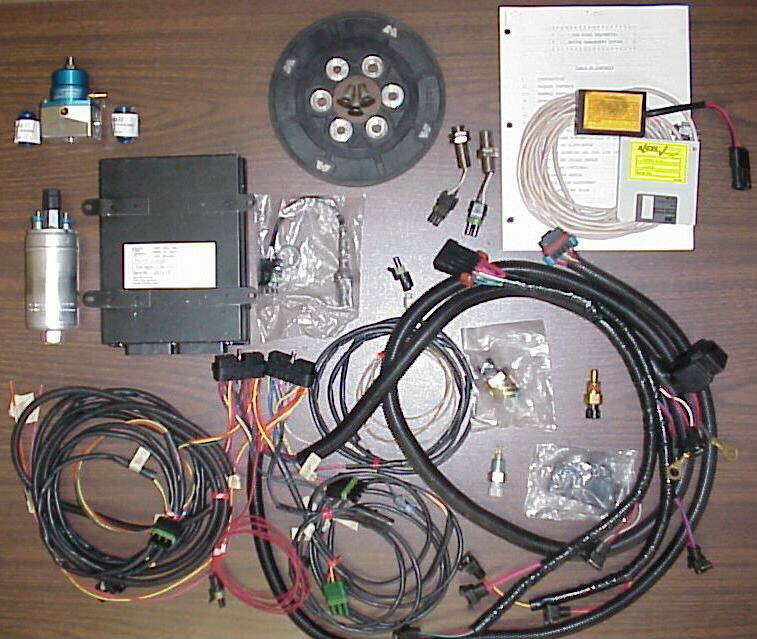
• Engine Control Systems:
installation and calibration
P dV has experience
with installing the aftermarket electronic fuel control systems of various
manufacturers. One such system was installed in P dV's
personal race car on a twin-turbocharged small-block Chevrolet engine. The
control system was a multi-point fuel injection type, requiring
modification to the intake manifold to accept fuel injectors. The control
system was mapped and calibrated to run the engine under boost conditions,
with several maps generated to run both gasoline and methanol fuels.
Separate spark timing maps were generated for use with each fuel type as
well.
|
|
P dV Has
Experience with Turbocharger Testing
|
|

|
• Turbocharger Testing: test
cell design and installation
A test cell
was designed for testing of automotive turbochargers independent of the
engine on which they are normally installed. Engine installations are
expensive to setup and maintain, and are not cost effective for testing of
turbochargers. The design criteria for the test cell were:
• Test to to SAE J1826, “Turbocharger Gas
Stand Test Code” standards
• Turbochargers to be fully mapped, generating compressor and
turbine flows, pressure ratios, and efficiency maps
• Provide pressurized and heated air to the turbine inlet at up to
1.0 kg/s, 1,400 kPa, and 600 degrees C
(2,000 cfm, 200 psi, and 1,100 degrees F)
• Throttles on the turbine inlet and compressor outlet control turbo
speed and pressure ratios
• A lubrication system to supply heated and pressurized oil to the
turbocharger
• A PC-based data acquisition system to monitor and record shaft
speeds, air flows, temperatures, and pressures
• Turbocharger parameters (i.e. corrected compressor speed)
calculated in real time and recorded with measured data
|
|
|
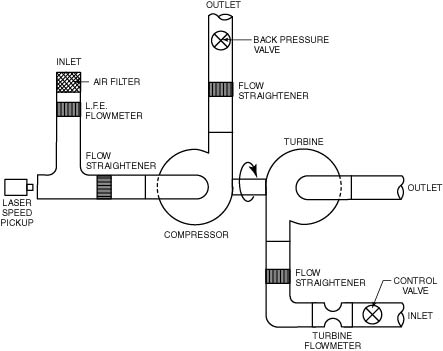
• Turbocharger Testing: test
cell instrumentation and data acquisition
The design of
the turbocharger test cell required special instrumentation for obtaining
turbo wheel speed. A laser speed pickup sensor was used to measure the
rotational speed of the compressor by aiming the laser at a reflective
section applied to the compressor hub. The system was able to detect wheel
speed when aimed through a window mounted in the intake tract. This was
required since air flow had to be accurately measured at the compressor
inlet. A Laminar Flow Element (LFE) air flow meter was installed in the
inlet to the compressor for that purpose. Throttles mounted on the
compressor outlet and turbine inlet controlled flows and pressure ratios,
thereby controlling wheel speeds. The throttles were remotely controlled
from the operators console. A large turbine flow
meter measured turbine inlet mass flow when required. Pressures and
temperatures measured at inlets and exits to both turbine and compressor
were used to calculate flow conditions and corrected parameters.
P dV designed and developed the LabVIEW software, and integrated it with an
HP hardware setup, to provide the data acquisition system which monitored
and recorded data.
|
|
|
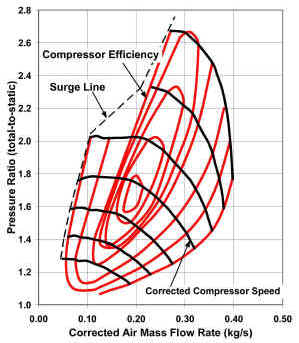
• Turbocharger Testing
compressor mapping, surge line, turbine mapping
Once the
turbocharger test cell was commissioned and calibrated, several
turbocharger units were placed under test. By following lines of constant
corrected compressor speeds, the pressure ratio was plotted versus
corrected air mass flow rate, providing a compressor map. By carefully
approaching the lower air flow rates, the surge line of the compressor was
defined. Software plotting packages allowed using the data to find lines of
constant compressor efficiency. By carefully selecting successive
compressors for a single turbine, a turbine map could be generated as well.
|
|